

 English


May 16, 2025
Sellics vs. CashCowPro vs. Shopkeeper
This is a comparison review of the three popular profit dashboard tools for Amazon sellers - Sellics, CashCowPro and Shopkeeper.
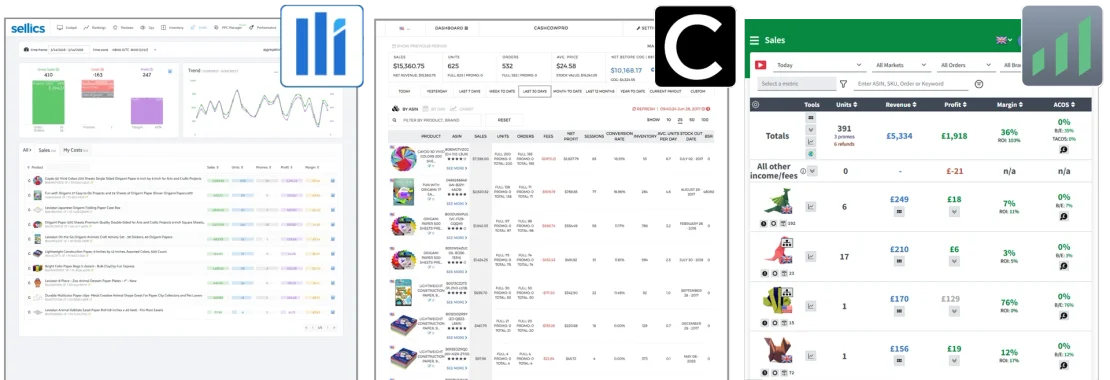
Sellics and CashCowPro provide multiple features, like Keyword Research, PPC Manager, A/B Testing, etc - but this article will focus solely on their profit dashboards.
- What fees and costs are accounted for?
- What Amazon marketplaces are supported?
- How do other features compare?
- What are the pros and cons of each Dashboard?
- How do these tools look like on mobile?
- How do the prices compare?
- Conclusion
What fees and costs are accounted for?
Here is a table with a list of fees and costs, showing if they are included or not in the three apps.
 Sellics |
 CashCowPro |
 Shopkeeper |
|
|---|---|---|---|
|
Manufacturing Costs & Shipping |
✔ |
✔ |
✔ |
|
Amazon Fees |
✔ |
✔ |
✔ |
|
Sponsored Ads PPC Costs |
✔ |
✔ |
✔ |
|
Headline Ads Costs |
✔ |
✘ |
✔ |
|
Promos |
✔ |
✔ |
✔ |
|
Refunds and Refund Fees |
✘ |
✔ |
✔ |
|
Sales Tax (VAT, State Tax, etc) |
✘ |
✔ |
✔ |
|
Monthly Storage Fees |
✘ |
✘ |
✔ |
|
Long Term Storage Fees |
✘ |
✘ |
✔ |
|
Reimbursements |
✘ |
✘ |
✔ |
|
Inventory Placement Fee |
✘ |
✘ |
✔ |
|
Aggregated Marketplaces View |
✘ |
✔ |
✔ |
|
Miscellaneous Business Expenses |
✘ |
✘ |
✔ |
|
Merchant-Fulfilled Shipping Costs |
✘ |
✘ |
✘ |
Sellics team is working on Profit Dashboard 2, which will include Refunds, Miscellaneous Business Expenses, and Merchant-Fulfilled Shipping Costs. For now, they have very limited expenses that their Profit Dashboard is tracking.
CashCowPro's future plans for more features have not been announced. But surely they've been receiving a lot of requests to add them, so I can expect they will eventually do it.
Shopkeeper is now working on adding Miscellaneous Business Expenses and other Amazon fees, like Lightning Deals Fee and Early Bird Reviewer Program fee.
None of the three software tools have all expenses covered fully at the moment, so you will have to compromise on those, depending what's more important to you.
What Amazon marketplaces are supported?
There are 11 countries where you can sell your products on a country-specific Amazon marketplace. Here is a list of which countries each of the software tools supports. The bigger the marketplace, the more apps support it.
|
Sellics |
CashCowPro |
Shopkeeper |
|
|---|---|---|---|
 Amazon.com - USA |
✔ |
✔ |
✔ |
 Amazon.ca - Canada |
✔ |
✔ |
✔ |
 Amazon.com.mx - Mexico |
✔ |
✔ |
✔ |
 Amazon.co.uk - UK |
✔ |
✔ |
✔ |
 Amazon.de - Germany |
✔ |
✔ |
✔ |
 Amazon.fr - France |
✔ |
✔ |
✔ |
 Amazon.es - Spain |
✔ |
✔ |
✔ |
 Amazon.it - Italy |
✔ |
✔ |
✔ |
 Amazon.co.jp - Japan |
✘ |
✘ |
✔ |
 Amazon.in - India |
✘ |
✘ |
✔ |
 Amazon.com.au - Australia |
✘ |
✘ |
✔ |
 Amazon.cn - China |
✘ |
✘ |
✘ |

Sellics does not have an aggregated view where the stats from all marketplaces would be combined - you will see data separately for each country. They are working on making this feature available, but there is no Estimated Date of when this will be live.
CashCowPro has an option to combine the stats for USA, Canada, Mexico, UK, Germany, France, Italy and Spain into one number. They don't release many updates, so I am thinking the other countries will not be added soon.
Stats from all marketplaces are summed up into one number in Shopkeeper. You can also view each country stats separately. It's all converted to the currency of your choice. Shopkeeper is the only one that supports Amazon Japan, Australia and India at the moment.
How do other features compare?
|
Sellics |
CashCowPro |
Shopkeeper |
|
|---|---|---|---|
Live Page Refresh to show new sales |
✘ |
✘ |
✔ |
Stats summed up from all Amazon marketplaces |
✘ |
✔ |
✔ |
Free Trial |
✔ CC Not Required - 14 Day Trial |
✔ CC Required - 10 Day Trial |
✔ CC Not Required - 14 Day Trial |
Number of Amazon Marketplaces supported |
8 |
8 |
11 |
Additional Features |
PPC Manager, Ranking Tracker, Review Tracker, Inventory Manager |
Product Research, A/B Testing, Keyword Ranking Tracker, Inventory Manager |
Inventory Overview, Hijack monitoring, To-Do list |
Choice of Preferred Display Currency |
✘ |
✔ |
✔ |
Notifications on daily sales by Email |
✘ |
✘ |
✘ |
What are the pros and cons of each Dashboard?
Sellics Dashboard looks like this:
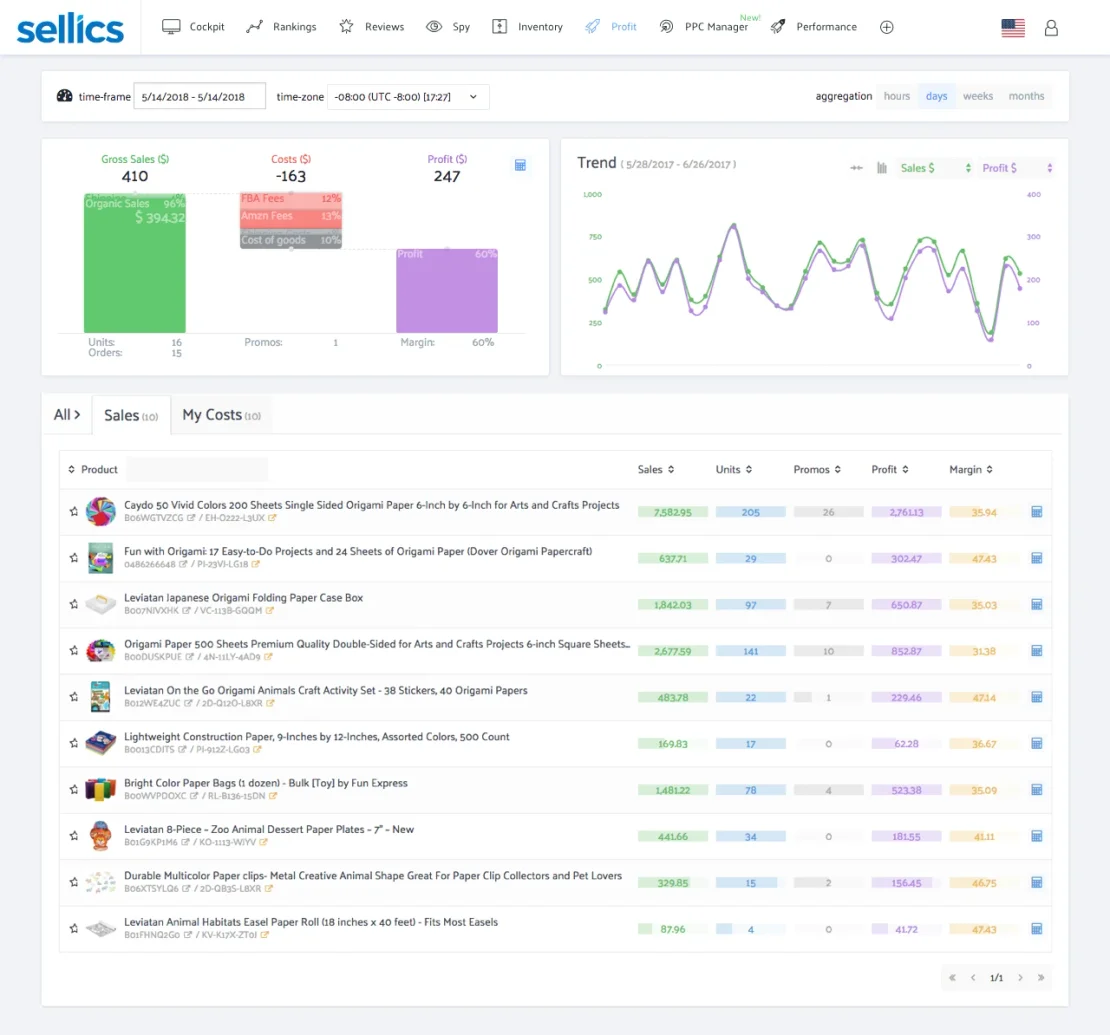
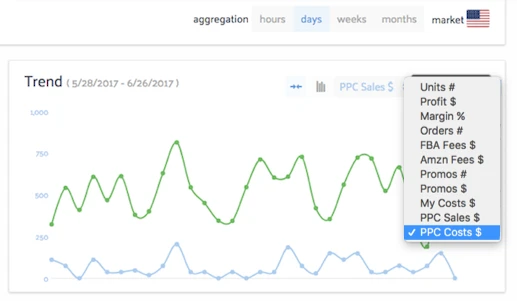
👍 Sellics best feature on the Profit Dashboard is their highly configurable trends graph. My favorite option is to view my PPC Sales compared to PPC Costs, using breakdown by day:
👍 There is an option to see all stats for one product that you select in Sellics. It's really useful to have a breakdown like this, as you can analyze the trends, costs, and profitability for every product individually. The Orders tab has links to the order details pages on Amazon Seller Central - very handy:
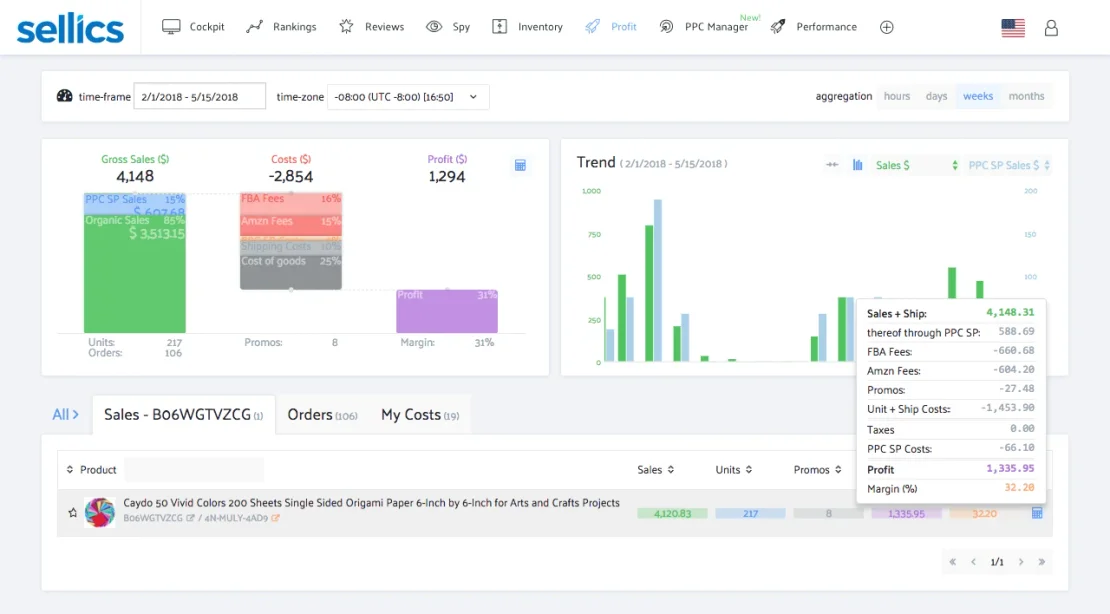
👍 I really like that in Sellics you can see how many of your sales came from Organic search and how many from Sponsored Product Ads:
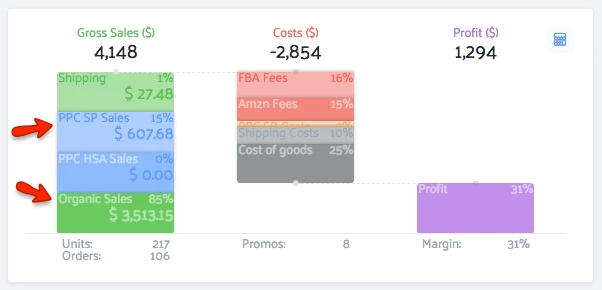
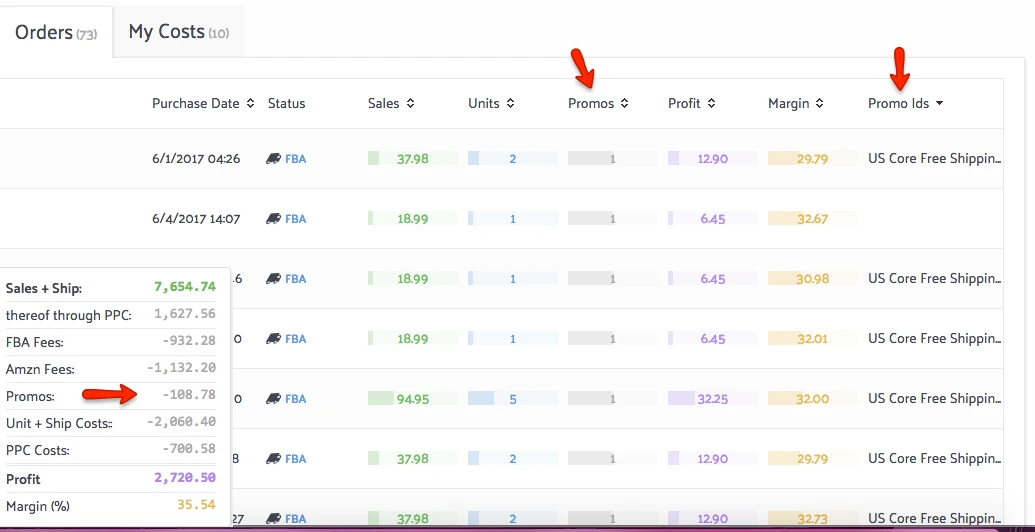
👎 Sellics shows and counts promos that are not created by me as a seller but created for the buyer by Amazon. For example, shipping promos. They are counted and displayed in the app as well, even though I did not create it. This promo value is then added to my revenue and then subtracted from it. So the revenue numbers become inflated.
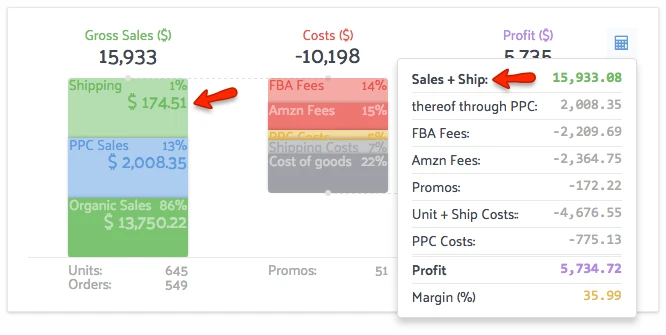
👎 I am an FBA seller, so I don't ship the products myself - Amazon manages the shipping - but in Sellics I still see Shipping included in my Revenue and later subtracted from the Revenue as Promos. Ideally, I would like to not see this extra revenue at all.
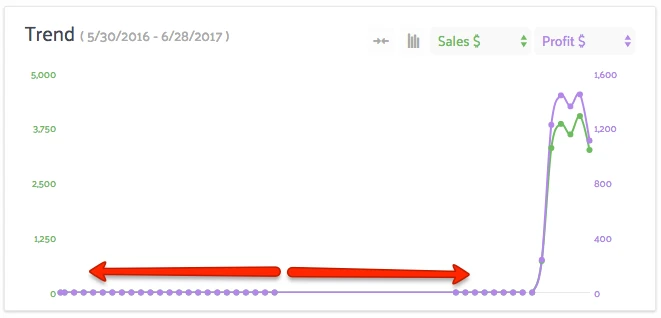
👎 Sellics historical data is limited, so you will not be able to see your sales from one year ago, if you only started using Sellics today. They pull only 1 month of historical data for Profit Dashboard.
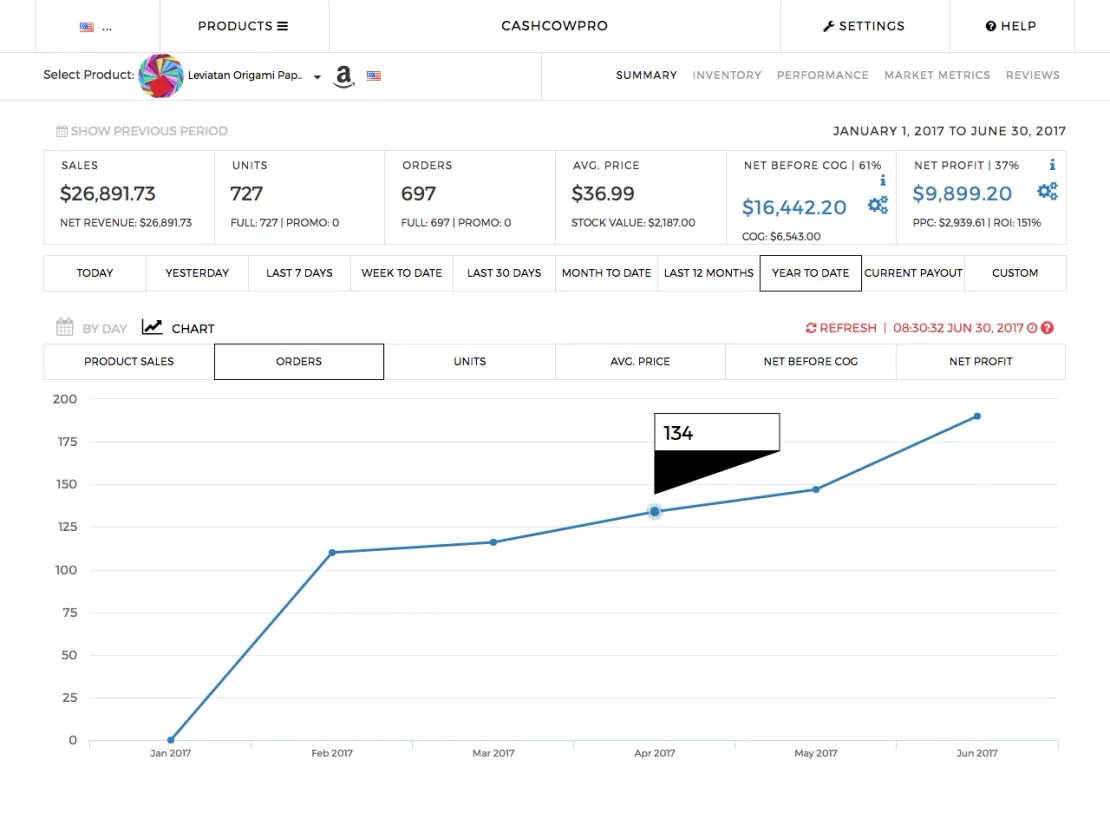
CashCowPro Dashboard looks like this:
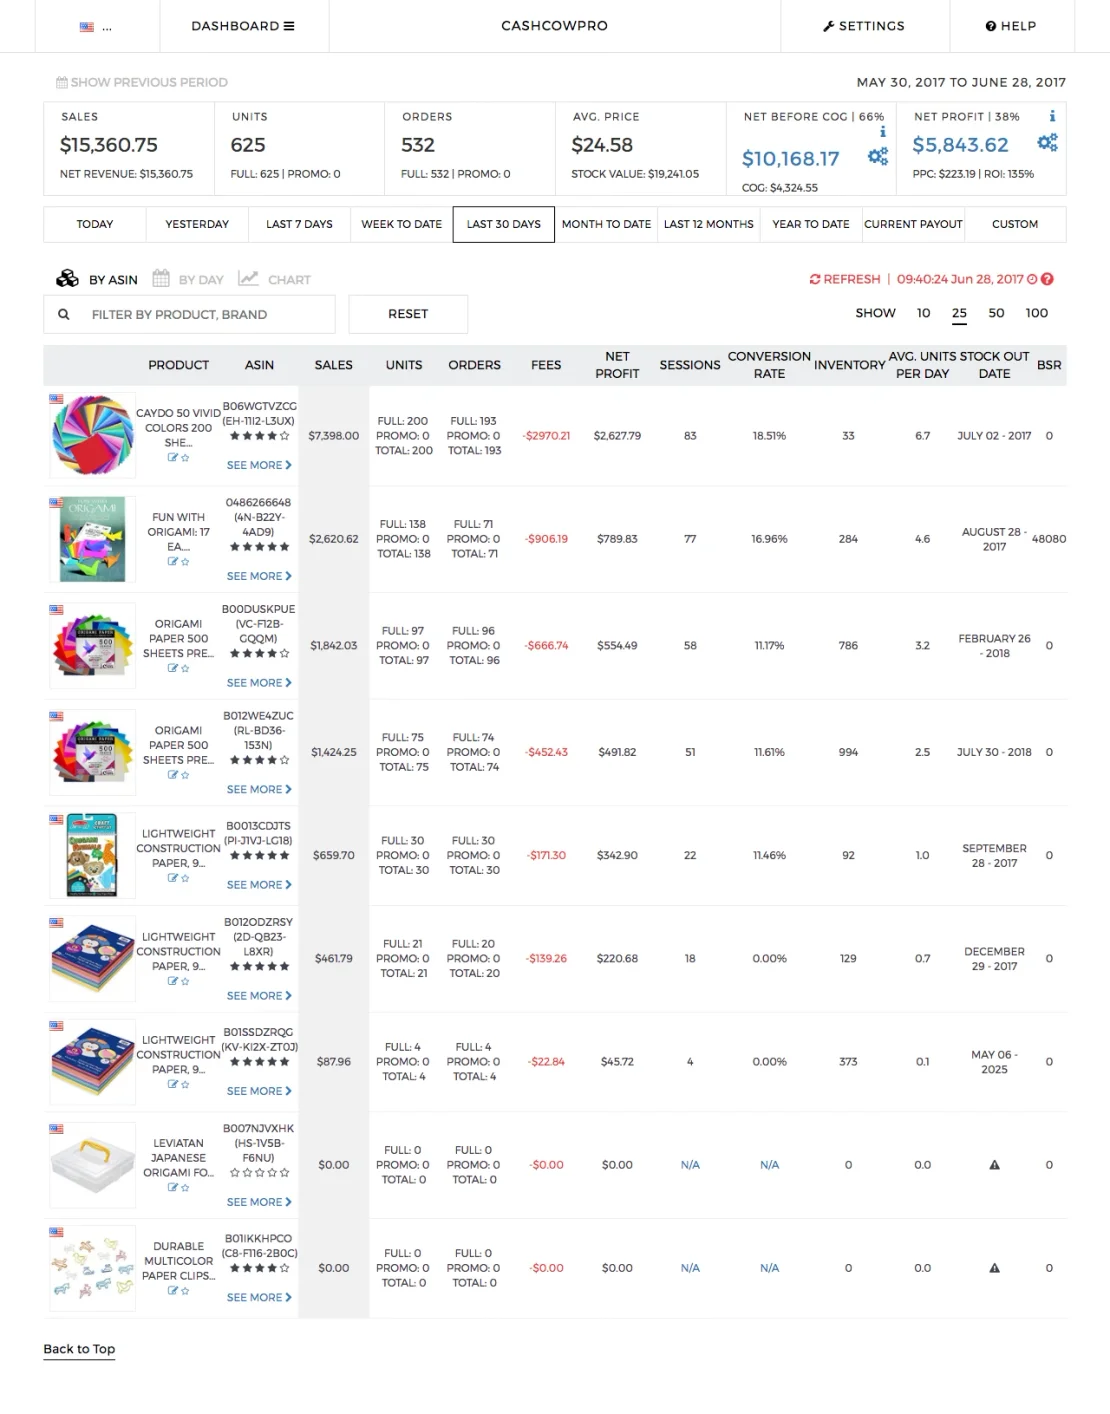
👍 CashCowPro has a really nice feature for breakdown by ASIN. You can see product trends showing your sales or net profit for example:
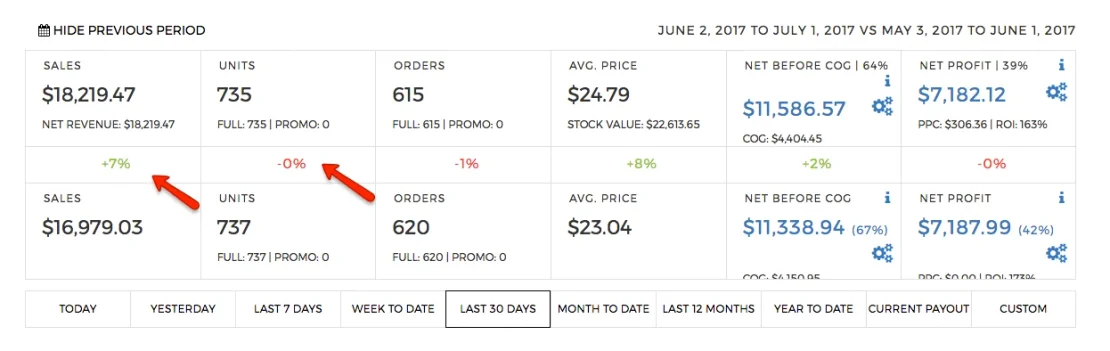
👍 I like the option to see previous period data compared to the current selection in CashCowPro. For example, if I select 'Last 30 Days', I can see my stats for the 30 days before that period as well. It gives me a good insight on how my business has been progressing:
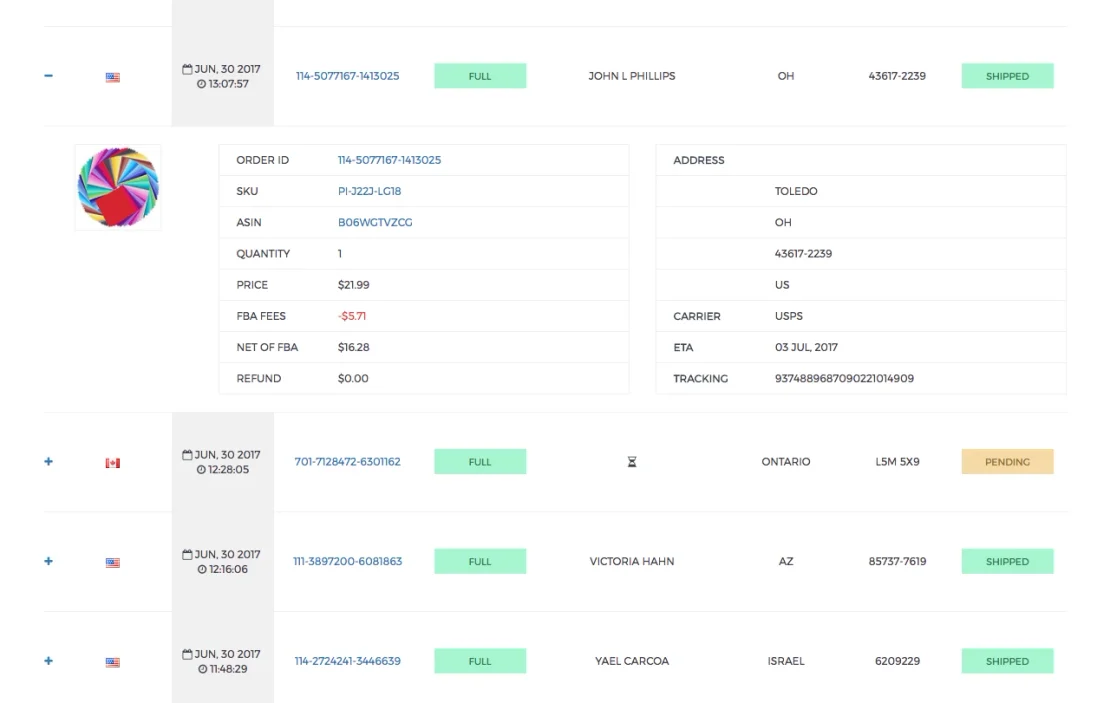
👍 You don't need to leave CashCowPro app and go to Seller Central to see all important details about the selected order. You can check the fees applied and view customer details from here:
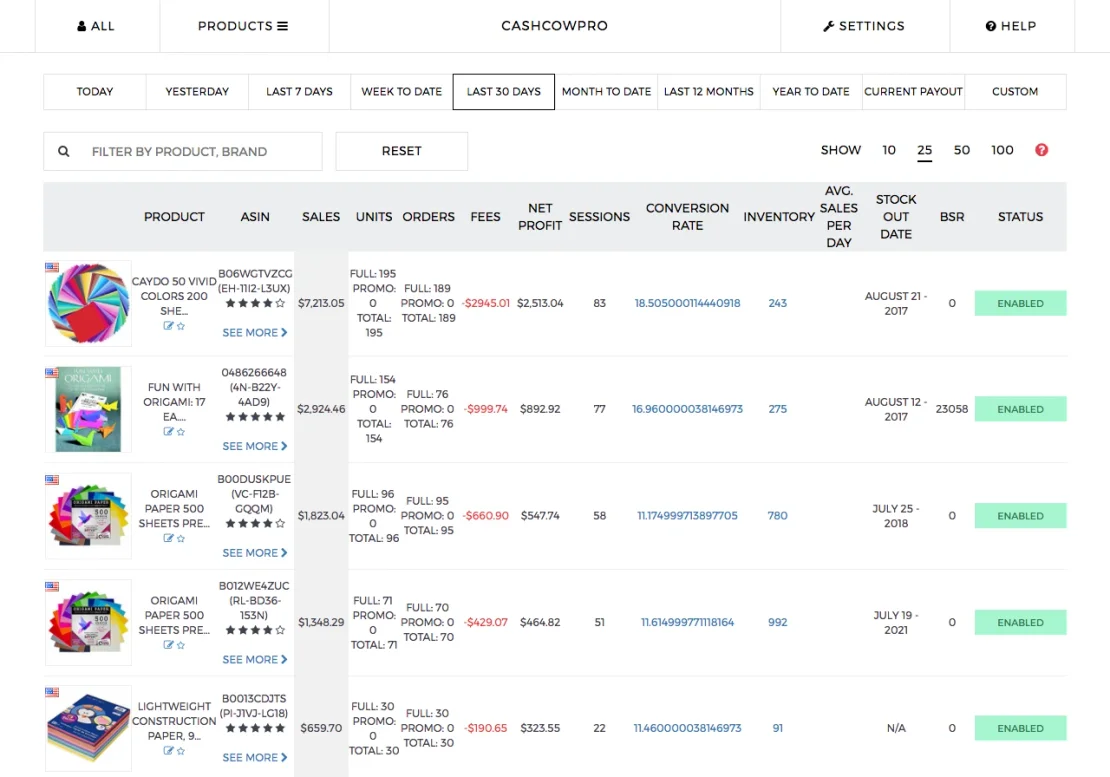
👎 CashCowPro presentation is a super busy spreadsheet-like list, listing all relevant and irrelevant things at once. With so many details it's hard to quickly see how the sales are going with one glance:
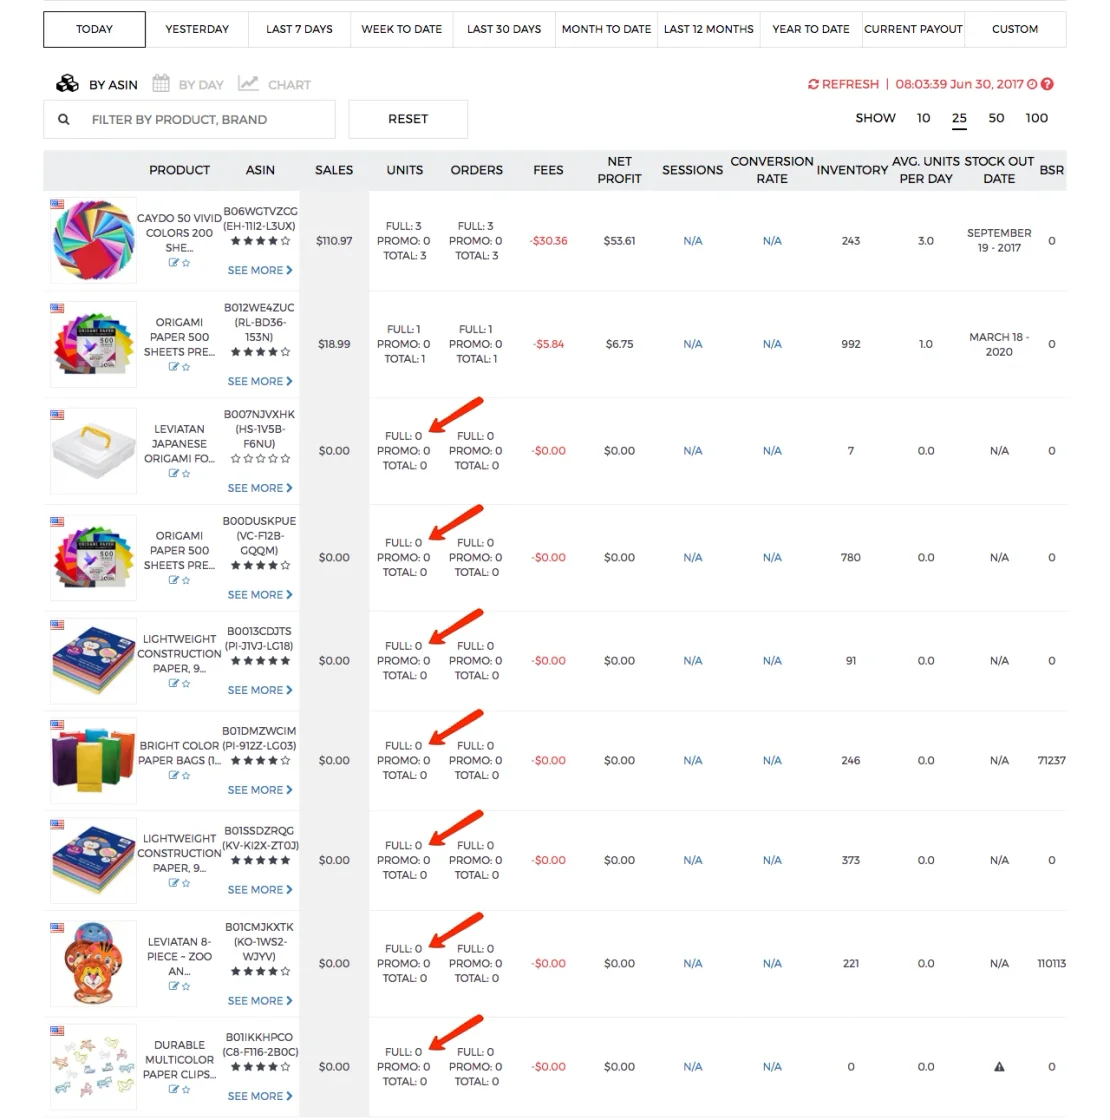
👎 When I select TODAY to see what I sold, CashCowPro lists all products even if there were no sales. I would prefer not to see all those zero rows.
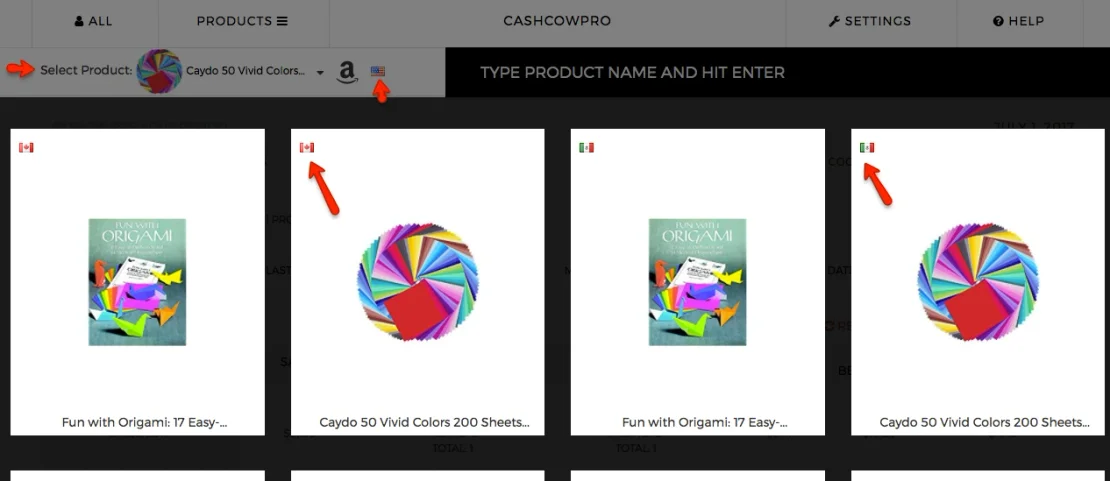
👎 CashCowPro's breakdown by-product does not sum up sales from all Amazon marketplaces as it does in the Dashboard. I can only see product trends for a specific country. I wish to be able to see how one product has been doing across all marketplaces.

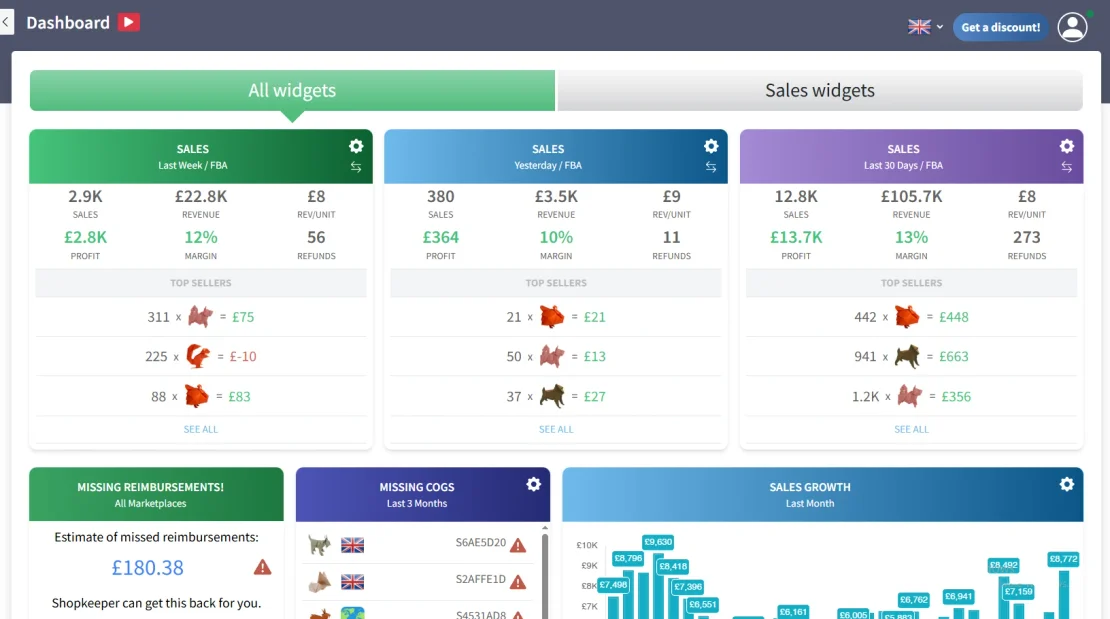
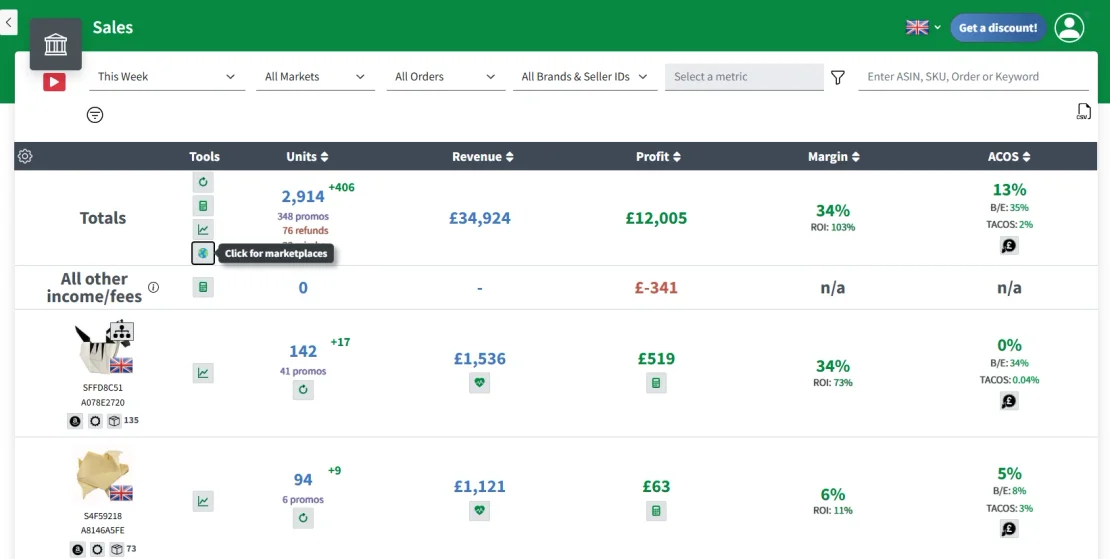
Shopkeeper's Dashboard looks like this:
👍 Shopkeeper combines stats from all marketplaces, into one number. You can choose your preferred currency, in which to see all the data. You can then expand each row to see which country sold how many units:
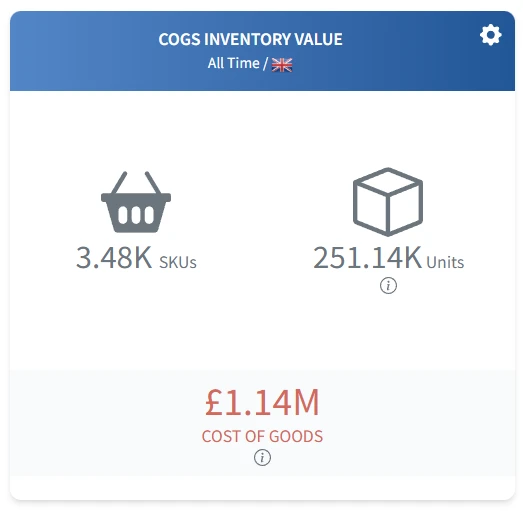
👍 Shopkeeper has useful widgets, like Inventory Value. You can see how much profit you would make if all your inventory would be sold today:
How do these tools look like on mobile?
Sellics and CashCowPro were not designed for mobile and are hard to read without zoom, while Shopkeeper looks beautiful:
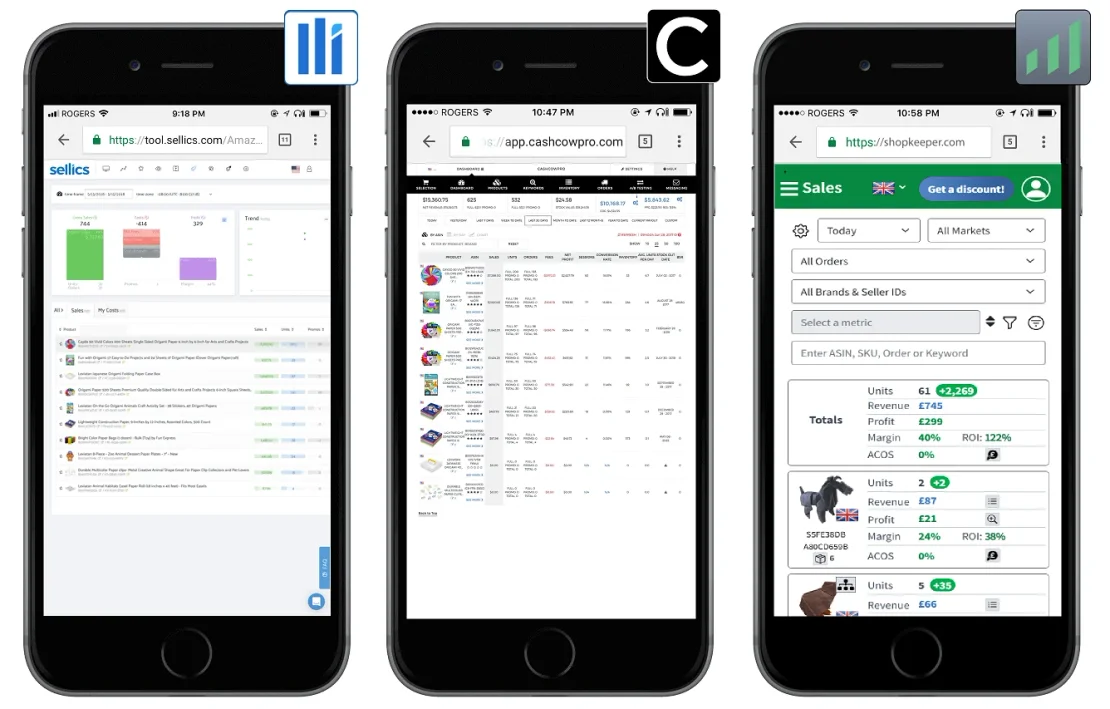
Sellics was designed for desktop use only, and on mobile it simply shrinks to fit the size of the screen. Font becomes super tiny and is hard to read. Navigating is hard, but with some zooming and side scrolling it can still be used.
CashCowPro was also designed for desktop use only. You will still be able to see your data, but it will not be easy to select those tiny little buttons and links.
Shopkeeper was designed to show a special modified view for mobile, so you will see your data easily without any zooming or side-scrolling.
How do the prices compare?
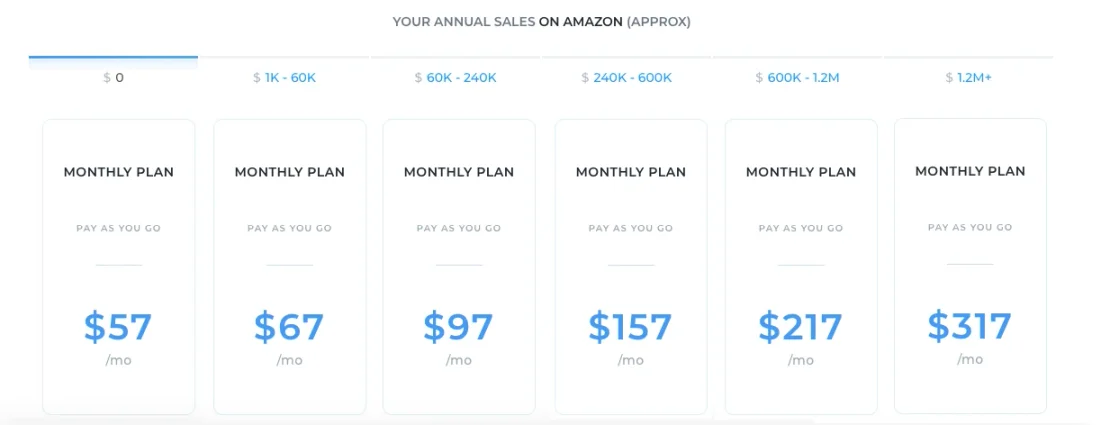
Sellics pricing is based on your yearly revenue. So if you're doing 60k (which, assuming a 40% margin, is $2,000 profit a month) - you will pay $97. It can quickly get costly if your products are priced high or your margins are low. Sellics pricing is more suitable for private label sellers. If you're an arbitrager or a wholesaler and your margins are slim, you may find it expensive.
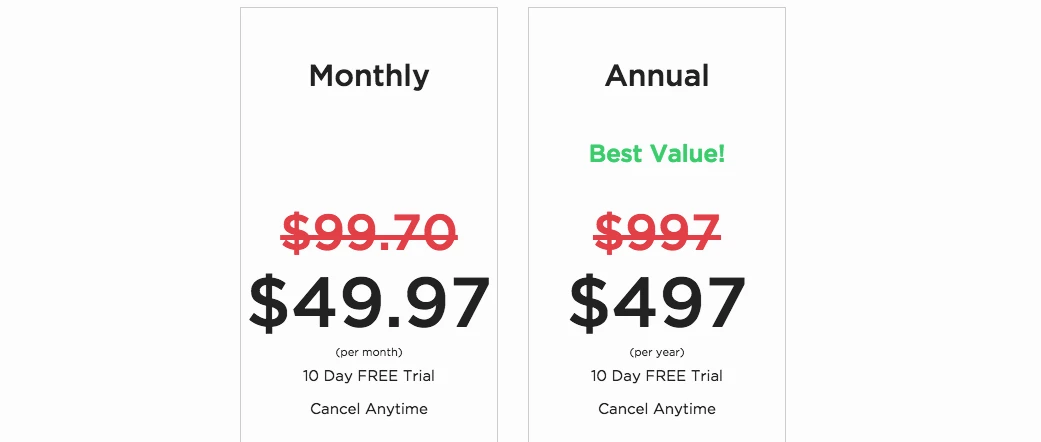
CashCowPro used to be only $30, but they have recently raised their prices to 50$ per month. It's a flat rate, and is still a great deal - considering all additional features that are included.
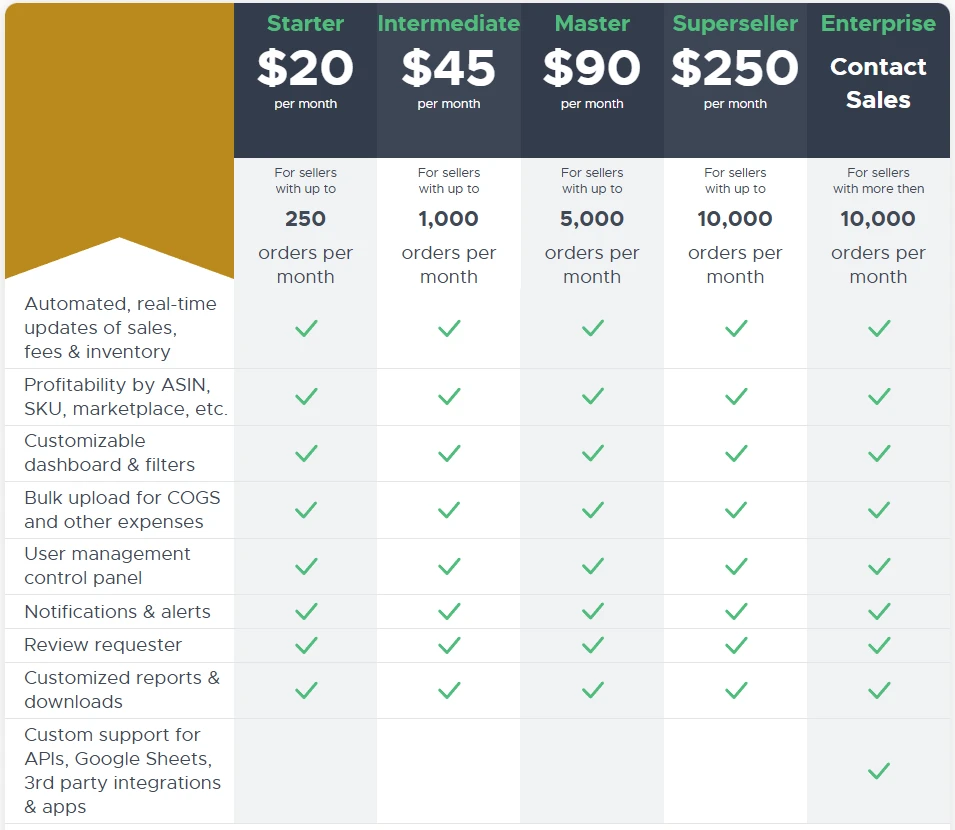
Shopkeeper charges 20$ for the first month, and after that the monthly fee depends on the number of orders you have that month:
Conclusion
If it's enough for you to know approximate profitability, you don't need exact figures and you would like to get additional features like PPC Manager or Ranking Tracker - you will choose Sellics. If you'd like to have many useful features in the same app, like A/B Testing, Product Research and a pretty good Profit Dashboard - you will choose CashCowPro. If you sell on multiple marketplaces (especially on Japan or India), and want to have more accurate numbers for profitability - you will go with Shopkeeper.


